Wednesday, June 1, 2016

Ramalan Tukaran Asing oleh Mardhiah dan Farah Dhiba

Ramalan Tukaran Asing 
oleh Mardhiah dan Farah Dhiba

Pasaran mata wang Forex boleh dianalisis menggunakan dua kaedah utama iaitu analisis fundamental dan analisis teknikal. Kedua-dua kaedah ini sangat berbeza, tetapi ia adalah alat ramalan yang sangat berguna untuk pelabur Forex, kerana mereka berkongsi matlamat yang sama iaitu untuk meramalkan pergerakan harga. Para penganalisis fundamental melihat sebab untuk pergerakan pasaran manakala yang menggunakan analisis teknikal melihat kepada kesan tingkah laku pasaran. Ramai pedagang Forex yang berjaya menggunakan campuran kedua-dua untuk mempunyai keputusan yang lebih baik.
Analisis Fundamental atau Fundamental Analysis adalah teknik analisis yang mengambil kira beberapa faktor, seperti prestasi perusahaan, analisis persaingan, analisis industri, analisis ekonomi dan pasaran makro dan mikro. Dari sini dapat diketahui bahawa adakah firma tersebut masih beroperasi atau tidak. Oleh itu, pelabur dapat mengetahui sama ada firma dalam keadaan yang baik dan boleh dipilih untuk tujuan pelaburan. Secara umumnya pengguna Analisis Fundamental ialah pelabur, terutama pelabur saham jangka panjang.
Penggunaan Analisis Fundamental tidak terbatas untuk saham sahaja ia juga boleh digunakan untuk menganalisis forex dan emas, tetapi cara menganalisis saham adalah sedikit berlainan. Pelabur yang menggunakan aspek fundamental di dalam menentukan keputusan pelaburannya disebut Fundamentalist. Analisis Fundamenal memerlukan data untuk dianalisis. Data boleh didapatkan daripada berita, data ekonomi, dan laporan kewangan yang boleh didapati di Bursa Malaysia. Berita tentang firma boleh didapati di surat khabar dan juga media elektronik. Manakala data-data ekonomi pula boleh didapati daripada Jabatan Perangkaan Malaysia dan juga Bank Negara Malaysia.
Cara melakukan Analisis Fundamental adalah melalui analisis top-down mulai dari keadaan ekonomi negara secara makro dan juga mikro. Analisis Makro adalah untuk mengetahui keadaan ekonomi negara secara keseluruhan iaitu sama ada ekonomi masih berkembang, inflasi yang tidak mengancam perkembangan ekonomi, dan sebagainya. Ekonomi negara yang berkembang akan mendorong kepada pertumbuhan firma-firma. Analisis kedua yang digunakan ialah Analisis Sektor iaitu untuk mengetahui keadaan industri. Ini kerana pelabur dapat mengetahui keadaan industri yang memiliki peluang untuk berkembang. Analisis Mikro adalah untuk mengetahui keadaan perusahaan. Contohnya, mengukur keadaan kewangan firma daripada Laporan Kewangan yang dikeluarkannya.
Analisis teknikal berbeza dengan analisis fundamental kerana analisis teknikal lebih kepada meramalkan pergerakan harga dan trend pasaran pada masa hadapan dengan mengkaji carta pergerakan pasaran pada masa lalu. Analisis teknikal ialah satu cara menganalisis data-data pada masa lalu yang diperolehi daripada pasaran. seperti data harga mata wang dan jumlah dagangan untuk digunakan sebagai alat utama analisis pada masa akan datang. Data-data tersebut selalunya ditayangkan dalam bentuk grafik.
Analisis teknikal terbahagi kepada tiga iaitu gelombang Elliott (Elliot Wave Trading), turutan nombor Fibonacci (Fibonacci sequence), dan indikator. Tiga aspek penting pergerakan harga dalam gelombang Elliott ialah pola, rasio dan waktu. Pola merujuk kepada pola atau formasi gelombang, manakala rasio ialah hubungan antara angka, khususnya deret Fibonacci yang digunakan untuk mengukur gelombang. Pedagang menentukan gelombang utama, atau (supercycle), sama ada berada dalam posisi beli (long) dan kemudian dalam posisi jual (short).
Turutan nombor Fibonacci menyediakan landasan matematik untuk Teori Gelombang Elliott. Nisbah Fibonacci akan disesuaikan dengan pelbagai indikator teknikal, nisbah ini paling banyak digunakan dalam analisis teknikal untuk mengukur gelombang pembetulan. Indikator dalam analisis teknikal adalah formula matematik yang berfungsi untuk mengetahui bagaimana keadaan pasaran dan dapat membantu memberikan signal beli atau jual. Terdapat banyak indikator yang telah dibuat. Tiap indikator memiliki karakter dan cara penggunaannya.

Antara 3 buah indikator analisis teknikal yang paling terkenal ialah Trend Following Indicator, Price Momentum Indicator dan Volatility Indicator. Trend Following Indicator ini digunakan untuk mengidentifikasi awal dan akhir suatu trend atau pada bila masa suatu trend akan berubah sehingga dapat diketahui waktu terbaik untuk membuka dan menutup posisi. Contoh Trend Indicator ialah Moving Average, Moving Average Convergence Divergence (MACD), Directional Movements Index (DMI) dan Parabolic SAR.
Jenis yang kedua ialah Price Momentum Indicator atau dipanggil sebagai Oscillator. Jenis indikator ini digunakan untuk mengidentifikasi situasi terlebih jual (oversold) atau terlebih beli (overbought). Momentum indicator juga digunakan untuk melihat apakah suatu trend masih berlanjut atau semakin melemah. Contoh indicator ini ialah Stochastic Oscillator, Relative Strength Index (RSI), dan Commodity Channel Index (CCI).
Indikator yang terakhir digunakan ialah Volatility Indicator. Indikator ini digunakan untuk melihat kekuatan pasaran yang dilihat dari segi turun naik harga dalam satu tempoh tertentu. Pasaran dikatakan memiliki volatility yang tinggi jika pergerakan harga naik turun secara tajam atau sangat cepat berubah-ubah di mana berlaku perbezaan harga yang besar antara harga tertinggi dan terendah. Contoh Volatility indicator ialah Bollinger Bands.



The History of Bretton Woods System by Kau Wing Jian and Lim Wooi Choon

The History of Bretton Woods System
by Kau Wing Jian and Lim Wooi Choon

In July 1944, an international monetary system known as the Bretton Woods system was created in the United Nations Monetary and Financial Conference was held at the Mount Washington Hotel in Bretton Woods, New Hampshire, where delegates from 44 nations. During the interwar period, the classic gold standard had been abandoned, meanwhile governments not only undertook competitive devaluations, but also set up restrictive trade policies that worsened the Great Depression. As a result, these countries saw the opportunity for a new international system that provide for post-war reconstruction after World War II. Afterward, they created this system that would not only avoid the stiffness of previous international monetary systems, but would also to improve the cooperation among the countries which participated in this systems. Thus, the Bretton Woods system was an unprecedented cooperative effort for nations that had been setting up barriers between their economies for more than a decade during war period. The aims of the Bretton Woods system was to ensure exchange rate stability, prevent competitive devaluations and promote economic growth.

The primary designer of the Bretton Woods system was John Maynard Keynes, served as an adviser to the British Treasury. However, Harry Dexter White served as the chief international economist at the Treasury Department in the United States. Keynes was one of the most influential economists of the time, planned for the creation of a large institution with the resources and authority to step in when imbalances occur. At the same time, this approach was consistent with his belief that public institutions should be able to intervene in times of crises. The Keynes plan to established a global central bank called the “Clearing Union”. This bank would issue a new international currency, the “bancor” which would be used to settle international imbalances. Keynes proposed raising funds of $26 million for the “Clearing Union”. Each nation would receive a limited credit that would prevent it from running a balance of payments deficit, but each country would also be discouraged from running surpluses by having to remit excess “bancor” to the Clearing Union. The plan reflected Keynes’s concerns about the global post-war economy.

In contrast, White’s plan for a new institution was one of more limited powers and resources. It reflected a problem that much of the financial resources of the “Clearing Union” envisioned by Keynes would be used to buy American goods, resulting in the United States holding the majority of bancor. White worried that America would end up being paid for its exports in “funny money”. Keynes lost the argument in his plan. Therefore, White proposed a new monetary institution called the “Stabilization Fund”. Rather than issue a new currency, it would be funded with a finite pool of national currencies and gold of $5 million that would effectively limit the supply of reserve credit. To summarize, the plan adopted at Bretton Woods which resembled the White plan with some concessions in response to Keynes’s concerns. A clause was added in case a country ran a balance of payments surplus and its currency became scarce in world trade. The fund could ration that currency and authorize limited imports from the surplus country. In addition, the total resources for the fund were raised from $5 million to $8.5 million.

The 730 delegates at Bretton Woods agreed to establish two new institutions. The International Monetary Fund (IMF) would monitor exchange rates and lend reserve currencies to nations with balance-of-payments deficits. The International Bank for Reconstruction and Development, now known as the World Bank Group, was responsible for providing financial assistance for the reconstruction after World War II and the economic development of less developed countries. Both the IMF and World Bank still survived and play important roles today, but each has fierce critics. The IMF has been criticised for the conditions it attaches to loans, which have been seen as too focused on austerity and the rights of creditors and too little concerned with the welfare of the poor. However, World Bank has mainly focused on loans to developing countries, has been criticised for failing to pay sufficient attention to the social and environmental consequences or negative externalities of the projects it funds.

The IMF came into formal existence in December 1945, when its first 29 member countries signed its Articles of Agreement. The countries agreed to keep their currencies fixed but adjustable (within a 1 percent band) to the dollar, and the dollar was fixed to gold at $35 an ounce. The Bretton Woods exchange-rate system saw all currencies linked to the dollar, and the dollar linked to gold. To prevent speculation against currency pegs, capital flows were severely restricted. To this day, when a country joins the IMF, it receives a quota based on its relative position in the world economy, which determines how much it contributes to the fund. In 1958, the Bretton Woods system became fully functional as currencies became convertible. Countries settled international balances in dollars, and US dollars were convertible to gold at a fixed exchange rate of $35 an ounce. The United States had the responsibility of keeping the price of gold fixed and had to adjust the supply of dollars to maintain confidence in future gold convertibility.

In 1971, President Richard Nixon ended the dollar’s convertibility to gold. The Bretton Woods system was in place until persistent US balance-of-payments deficits led to foreign-held dollars exceeding the US gold stock, implying that the United States could not fulfil its obligation to redeem dollars for gold at the official price. This is because a sizable increase in domestic spending on President Lyndon Johnson's Great Society programs and a rise in military spending caused by the Vietnam War gradually worsened the overvaluation of the dollar. By March 1973 the major currencies began to float against each other. Since the collapse of the Bretton Woods system, IMF members have been free to choose any form of exchange arrangement they wish (except pegging their currency to gold) allowing the currency to float freely, pegging it to another currency or a basket of currencies, adopting the currency of another country, participating in a currency bloc, or forming part of a monetary union.

With the end of Bretton Woods in 1970s, money has no tie to gold or any anchor anymore, it formed variety of exchange rate regime and capital control. In this situation, most rich country’s currencies float more which means less freely, whereas emerging country’s currencies more freer in capital flow because of globalization and removal of restriction. Due to freer flow, countries can control their currencies to avoid currency sudden soar. When capital pours in, central bank buy the currencies to control their currency. In current decade, many countries especially the emerging countries have learnt the lesson from the economic crisis in 1998 and 2008, they found that keeping extremely high quantity reserve is the key to survive during economic crisis. The reserve is mainly use to cover emergency imports and short-term debt payments. The best example is China, China did managed to limit their capital flow to make sure the Yuan is cheap without causing consumer inflation. In the other hand, they kept a large fraction of the global built up reserves. This large fraction of global built up reserve make an large impact on international monetary market. This causes many emerging countries are not willing to risk their currencies to rise to stay competitive in market. As a result many of the world's most vibrant economies in effect shadow the dollar, in an arrangement that has been dubbed “Bretton Woods 2”.


DETERMINANTS OF THE EXCHANGE RATE IN THE LONG RUN by Alia Munirah and Muhammad Rusydi


DETERMINANTS OF THE EXCHANGE RATE IN THE LONG RUN 

by Alia Munirah and Muhammad Rusyd
In the long run, currency moves in response to price differences so that long run prices for the same goods are the same across borders.

HOW TO CREATE OFFER CURVE by Siti Hajar and Nur Syaheeda

HOW TO CREATE OFFER CURVE
by Siti Hajar and Nur Syaheeda


In economics and particularly in international trade, an offer curve shows the quantity of one type of product that an agent will export ("offer") for each quantity of another type of product that it imports. An offer curve is alternatively called the reciprocal demand curve of a country. It indicates the quantity of imports and exports that a country is willing to buy and sell on the world market at all possible relative prices. More specifically, the curve shows the country willingness to trade at various possible terms-of-trade.

Theory of reciprocal demand asserts that within the outer limits of the terms of trade, the actual terms of trade is determined by the relative strength of each country’s demand for the country’s product. Simply put, production costs determine the outer limits of the terms of trade, while reciprocal demand determines what the actual terms of trade will be within those limits.
The reciprocal-demand theory best applies when the two nations are of equal economic size, so that the demand of each nation has a noticeable effect on market price. However, if two nations are of unequal economic size, it is possible that the relative demand strength of the smaller nation will be dwarfed by that of the larger nation. In this case, the domestic exchange ratio of the larger nation will be prevail. Assuming the absence of monopoly elements working in the markets, the small nation can export as much of the commodity as it desires, enjoying large gains from trade.
Consider trade in crude oil and autos between Venezuela and United States before the rise of the Organization of Petroleum Exporting Countries (OPEC). Venezuela, as a small nation, accounted for only a very small share of the U.S. Venezuelan market, whereas the U.S. market share was overwhelmingly large. Because Venezuelan consumers and producers had no influence on market price levels, they were in effect price takers. In trading with the United States, no matter what the Venezuelan demand was for crude oil and autos, it was not strong enough to affect U.S. price levels. As a result, Venezuelan traded according to the U.S. domestic price ratio, buying and selling autos and crude oil at the price levels that existed within the United States.

PERBANDINGAN ANTARA TARIF DAN KUOTA oleh Lee Yun Yi dan Sam Pei Jun


PERBANDINGAN ANTARA TARIF DAN KUOTA 

oleh Lee Yun Yi dan Sam Pei Jun


Secara umumnya, sekatan perdagangan dapat dibezakan kepada dua jenis iaitu sekatan tarif dan sekatan bukan tarif. Sekatan tarif merupakan sekatan perdagangan dalam bentuk cukai yang dikenakan atas barang import. Tarif terbahagi kepada tarif ad-valorem, tarif spesifik, dan tarif kompaun. Manakala, kuota import adalah sekatan bukan tarif dan merupakan sekatan perdagangan yang mengehadkan kuantiti maksimum barang yang boleh diimport dalam jangka masa tertentu. Secara amnya, kuota import boleh dibahagikan kepada dua jenis iaitu kuota global dan kuota terpilih. Sekatan perdagangan yang lain bukan tarif seperti kuota kadar-tarif, halangan eksport sukarela (VER), subsidi, dan lambakan.
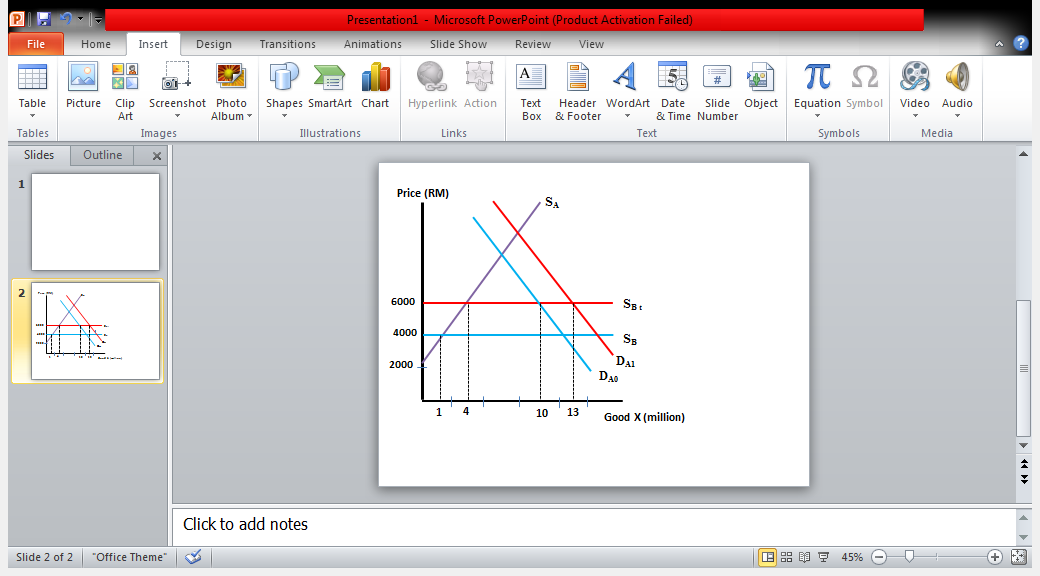
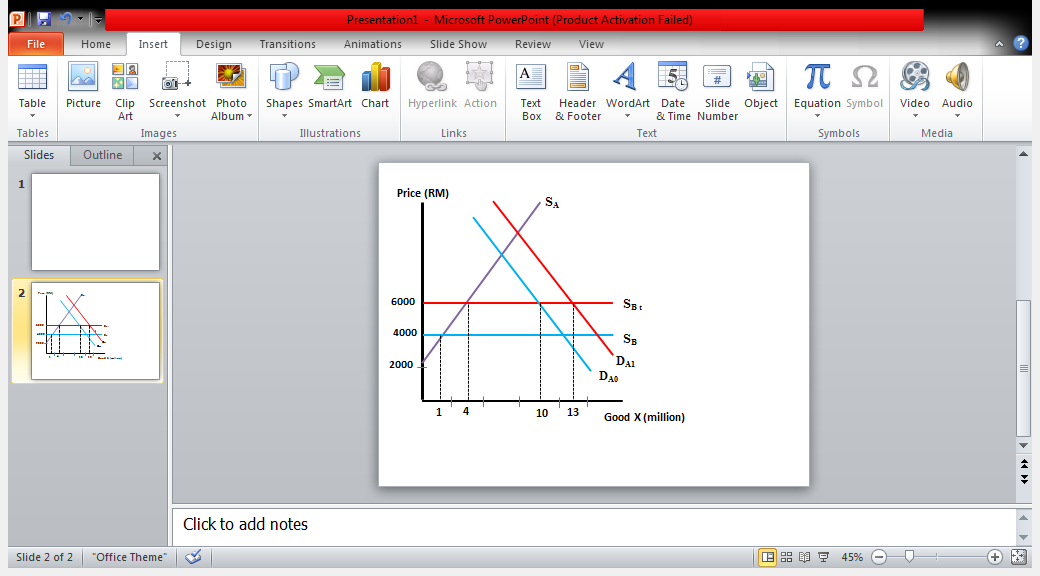
Perbezaan antara tarif dan kuota boleh dilihat sekiranya berlaku peningkatan permintaan terhadap barang yang diimport. Terdapat 2 buah negara iaitu negara A dan negara B. Keluk permintaan dan penawaran negara A ditunjukkan oleh DA dan SA; SB pula menunjukkan keluk penawaran barang X oleh negara B.  Negara A boleh memilih sama ada mengenakan tarif dan kuota ke atas barang X yang diimport untuk melindungi firma domestik.
Rajah 1 : Kesan perdagangan oleh tarif dan kuota


Rajah1(a) Tarif Import        Rajah1(b) Kuota Import
Merujuk Rajah 1(a), negara A telah melaksanakan tarif import sebanyak RM2000, ini menyebabkan harga barang X yang diimport dari negara B meningkat daripada RM4000 ke RM6000. Manakala, import barang X jatuh daripada 12 juta kepada 6 juta unit. Andaikan permintaan barang X negara A meningkat daripada DA0 kepada DA1. Permintaan naik tetapi harga barang X kekal pada tingkat harga sama iaitu RM6000. Ini kerana harga di negara A tidak berbeza daripada harga barang X di negara B ditambah dengan cukai tarif. Import barang X naik daripada 6 juta unit ke 9 juta unit. Kesimpulannya, di bawah tarif import, pelarasan domestik berbentuk peningkatan dalam kuantiti barang X yang diimport dan bukan kenaikan dalam harga barang X.
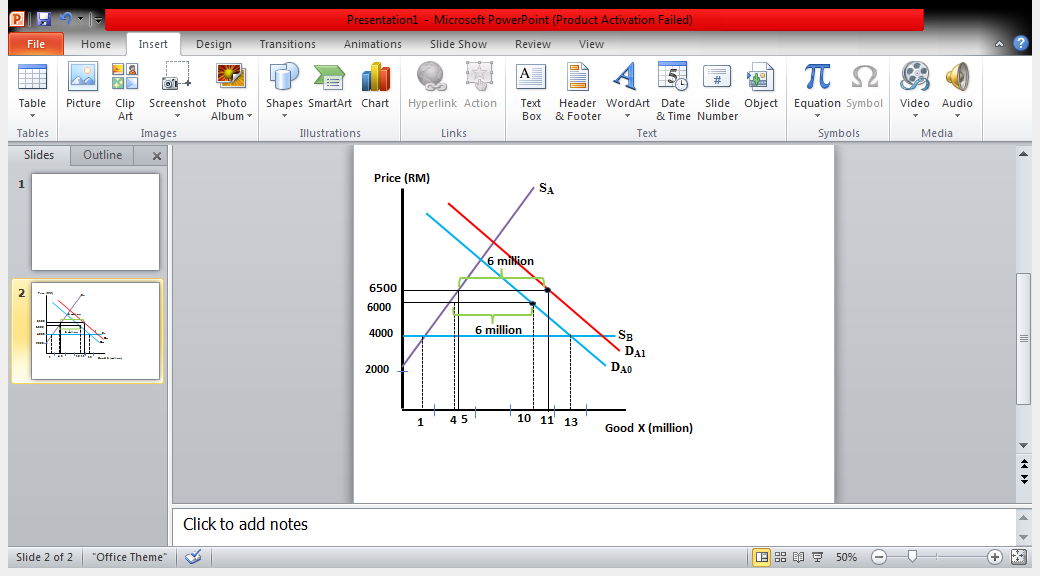
Rajah 1(b) pula menunjukkan negara A telah melaksanakan kuota import yang telah ditetapkan sebanyak 6 juta dan ini meletakkan negara A di dalam keadaan perdagangan yang sama seperti di bawah tarif. Had ditetapkan ke atas barang X menyebabkan harga naik daripada RM4000 kepada RM6000. Andaikan permintaan negara A ke atas barang X meningkat daripada DA0 kepada DA1, ini akan menyebabkan harga barang X domestik naik. Di bawah kuota, tidak ada had di mana harga barang X di negara A boleh meningkat melebihi harga barang X daripada negara B. Dengan kenaikan harga barang X domestik, firma di negara A akan menambahkan pengeluaran. Peningkatan permintaan daripada DA0 ke DA1, menyebabkan harga naik dari RM6000 kepada RM6500. Pada harga baru ini, pengeluaran domestik adalah 5 juta unit, sementara permintaan domestik adalah 11 juta unit. Jumlah import pula 6 unit, iaitu jumlah sama di bawah program kuota sebelum berlakunya peningkatan dalam permintaan. Dalam kes kuota import ini, pelarasan yang berlaku adalah dalam bentuk harga domestik dan bukan kuantiti barang X yang diimport.
Semasa keadaan permintaan bertambah kuota import merupakan halangan perdagangan yang lebih berkesan berbanding dengan tarif import. Dibawah kuota, kerajaan menetapkan kuantiti import; sementara dibawah tarif, harga domestik boleh naik melebihi harga dunia sebanyak jumlah tarif yang dikenakan. Pengguna domestik masih boleh membeli kuantiti import yang tidak terhad jika mereka mahu dan mampu membayarnya. Oleh itu, kuota memberikan industri domestik “siling” ke atas import dan tidak mengambil kira keadaan pasaran yang berubah-ubah.


Tariffs versus Quotas
Generally, trade policy can be categorized by tariffs and nontariff trade barriers. Tariffs can be defined as taxes or duties levied on a product when it crosses national boundaries. Import tariffs levied on imported goods whereas export tariffs levied on exported goods. There are three types of tariffs which are specific tariff, ad valorem tariff and compound tariff. On the other hand, import quota is one of the nontariff trade barriers among the international trade restrictions. Import quota limits the total quantity of goods that may enter a country within a given period. There are two types of import quota which are global quota and selected quota. Other examples for nontariff trade barriers are tariff-rate quotas, voluntary export restraints, subsidies and dumping.
The difference between tariffs and quotas can be show clearly with an example in the case of growing demand. In this case, there are only two countries involve which are country A and country B. The demand and supply curve for country A are given by DA and SA, and SB represents country B supply curve of goods X. Now, country A can choose either tariffs or quotas imposed on the imported goods X to protect its domestic firms.
Figure 1 : Trade Effects of Tariffs and Quotas


Figure 1(a) Import Tariff Figure 1(b) Import Quota
In figure 1(a), country A imposed an import tariff of RM2000 on imported goods X and raises the price of X in country A from RM4000 to RM6000. Quantity of imported goods X falls from 12 million units (13 million units - 1 million units) to 6 million units (10 million units - 4 million units). Now, suppose country A demand for imported goods X rises from DA0 to DA1. Despite the increased demand, the price of imported goods X remains constant at RM6000. This is because the price in country A cannot differ from the price in country B by an amount exceeding the tariff duty. Imported goods X rises from 6 million units (10 million units - 4 million units) to 9 million units (13 million units - 4 million units). Therefore, under an import tariff, domestic adjustment increase the quantity of imported goods X rather than price X.
In figure 1(b), country A imposed an import quota of 6 million units on imported goods X and raises the price of X in country A from RM4000 to RM6000. An identical demand increase will lead to an increase in domestic price of goods X. Under an import quota, there is no limit on the extent to price in country A can rise above the price in country B. Given an increase in price of domestic goods X, companies of country A are able to expand their production. An increase in demand for goods X rises from DA0 to DA1 forces the price up from RM6000 to RM6500. At the new price, domestic production equals 5 million units and domestic consumption equals 11 million units. Total imports remain same amount as under the quota before the increase in domestic demand which is 6 million units. Thus, adjustment occurs in domestic prices rather than quantity of imported goods.
In growing demand, an import quota is a more restrictive trade barrier than import tariff. Under a quota, the government limits the imports quantity arbitrarily whereas under a tariff, the domestic price can rise above the world price by the amount of tariff; domestic consumers can still purchase unlimited imported goods if they are willing and able to pay for them. Therefore, a quota assures the domestic industry a ceiling on imports regardless of changing market conditions.


MASALAH NEGARA MEMBANGUN DAN CARA MENGATASINYA oleh Nur Syahira dan Norshamira

MASALAH NEGARA MEMBANGUN DAN CARA MENGATASINYA 

oleh Nur Syahira dan Norshamira

Negara membangun dapat digambarkan sebagai sebuah negara yang mempunyai keselesaan dari aspek kebendaan dan material kepada penduduknya. Negara membangun juga mempunyai pendapatan yang rendah, infrastruktur yang kurang membangun dan juga indeks perkembangan manusia yang kurang jika dibandingkan dengan negara global yang lain. Contoh negara membangun adalah negara Malaysia, Indonesia, Filipina dan lain-lain. Masalah negara membangun dan cara mengatasinya adalah seperti penduduk, pengangguran, tingkat produktiviti penduduk, dan keterbergantungan kepada perdagangan luar negera. 
1.      Keterbergantungan kepada perdagangan luar negara
Negara membangun umumnya masih belum mampu untuk memenuhi keperluan dan kehendak penduduk mereka sendiri. Oleh itu, mereka amat bergantung kepada barangan dan produk yang diimport dari luar negara untuk menampung keperluan mereka. Selain itu, kecintaan terhadap barangan tempatan adalah kurang sehingga menyebabkan permintaan terhadap barangan import semakin meningkat. Cara untuk mengatasi masalah ini adalah dengan campur tangan kerajaan yang menggalakkan penggunaan barangan tempatan melalui kempen dengan bantuan media massa seperti yang dijalankan di Malaysia iaitu  kempen “Belilah Barangan Buatan Malaysia”. Selain itu, pihak swasta haruslah bertindak proaktif untuk memperluaskan perniagaan dengan mempromosikan barangan tempatan secara menyeluruh di seluruh negara.

Pusingan Terakhir

Muhammad Arif and Muhamad Naim
Exchange Rate Overshooting

Tarif

https://drive.google.com/open?id=12vbCvdpQwnU15HuzvbQ1eYD9-flqbU1F